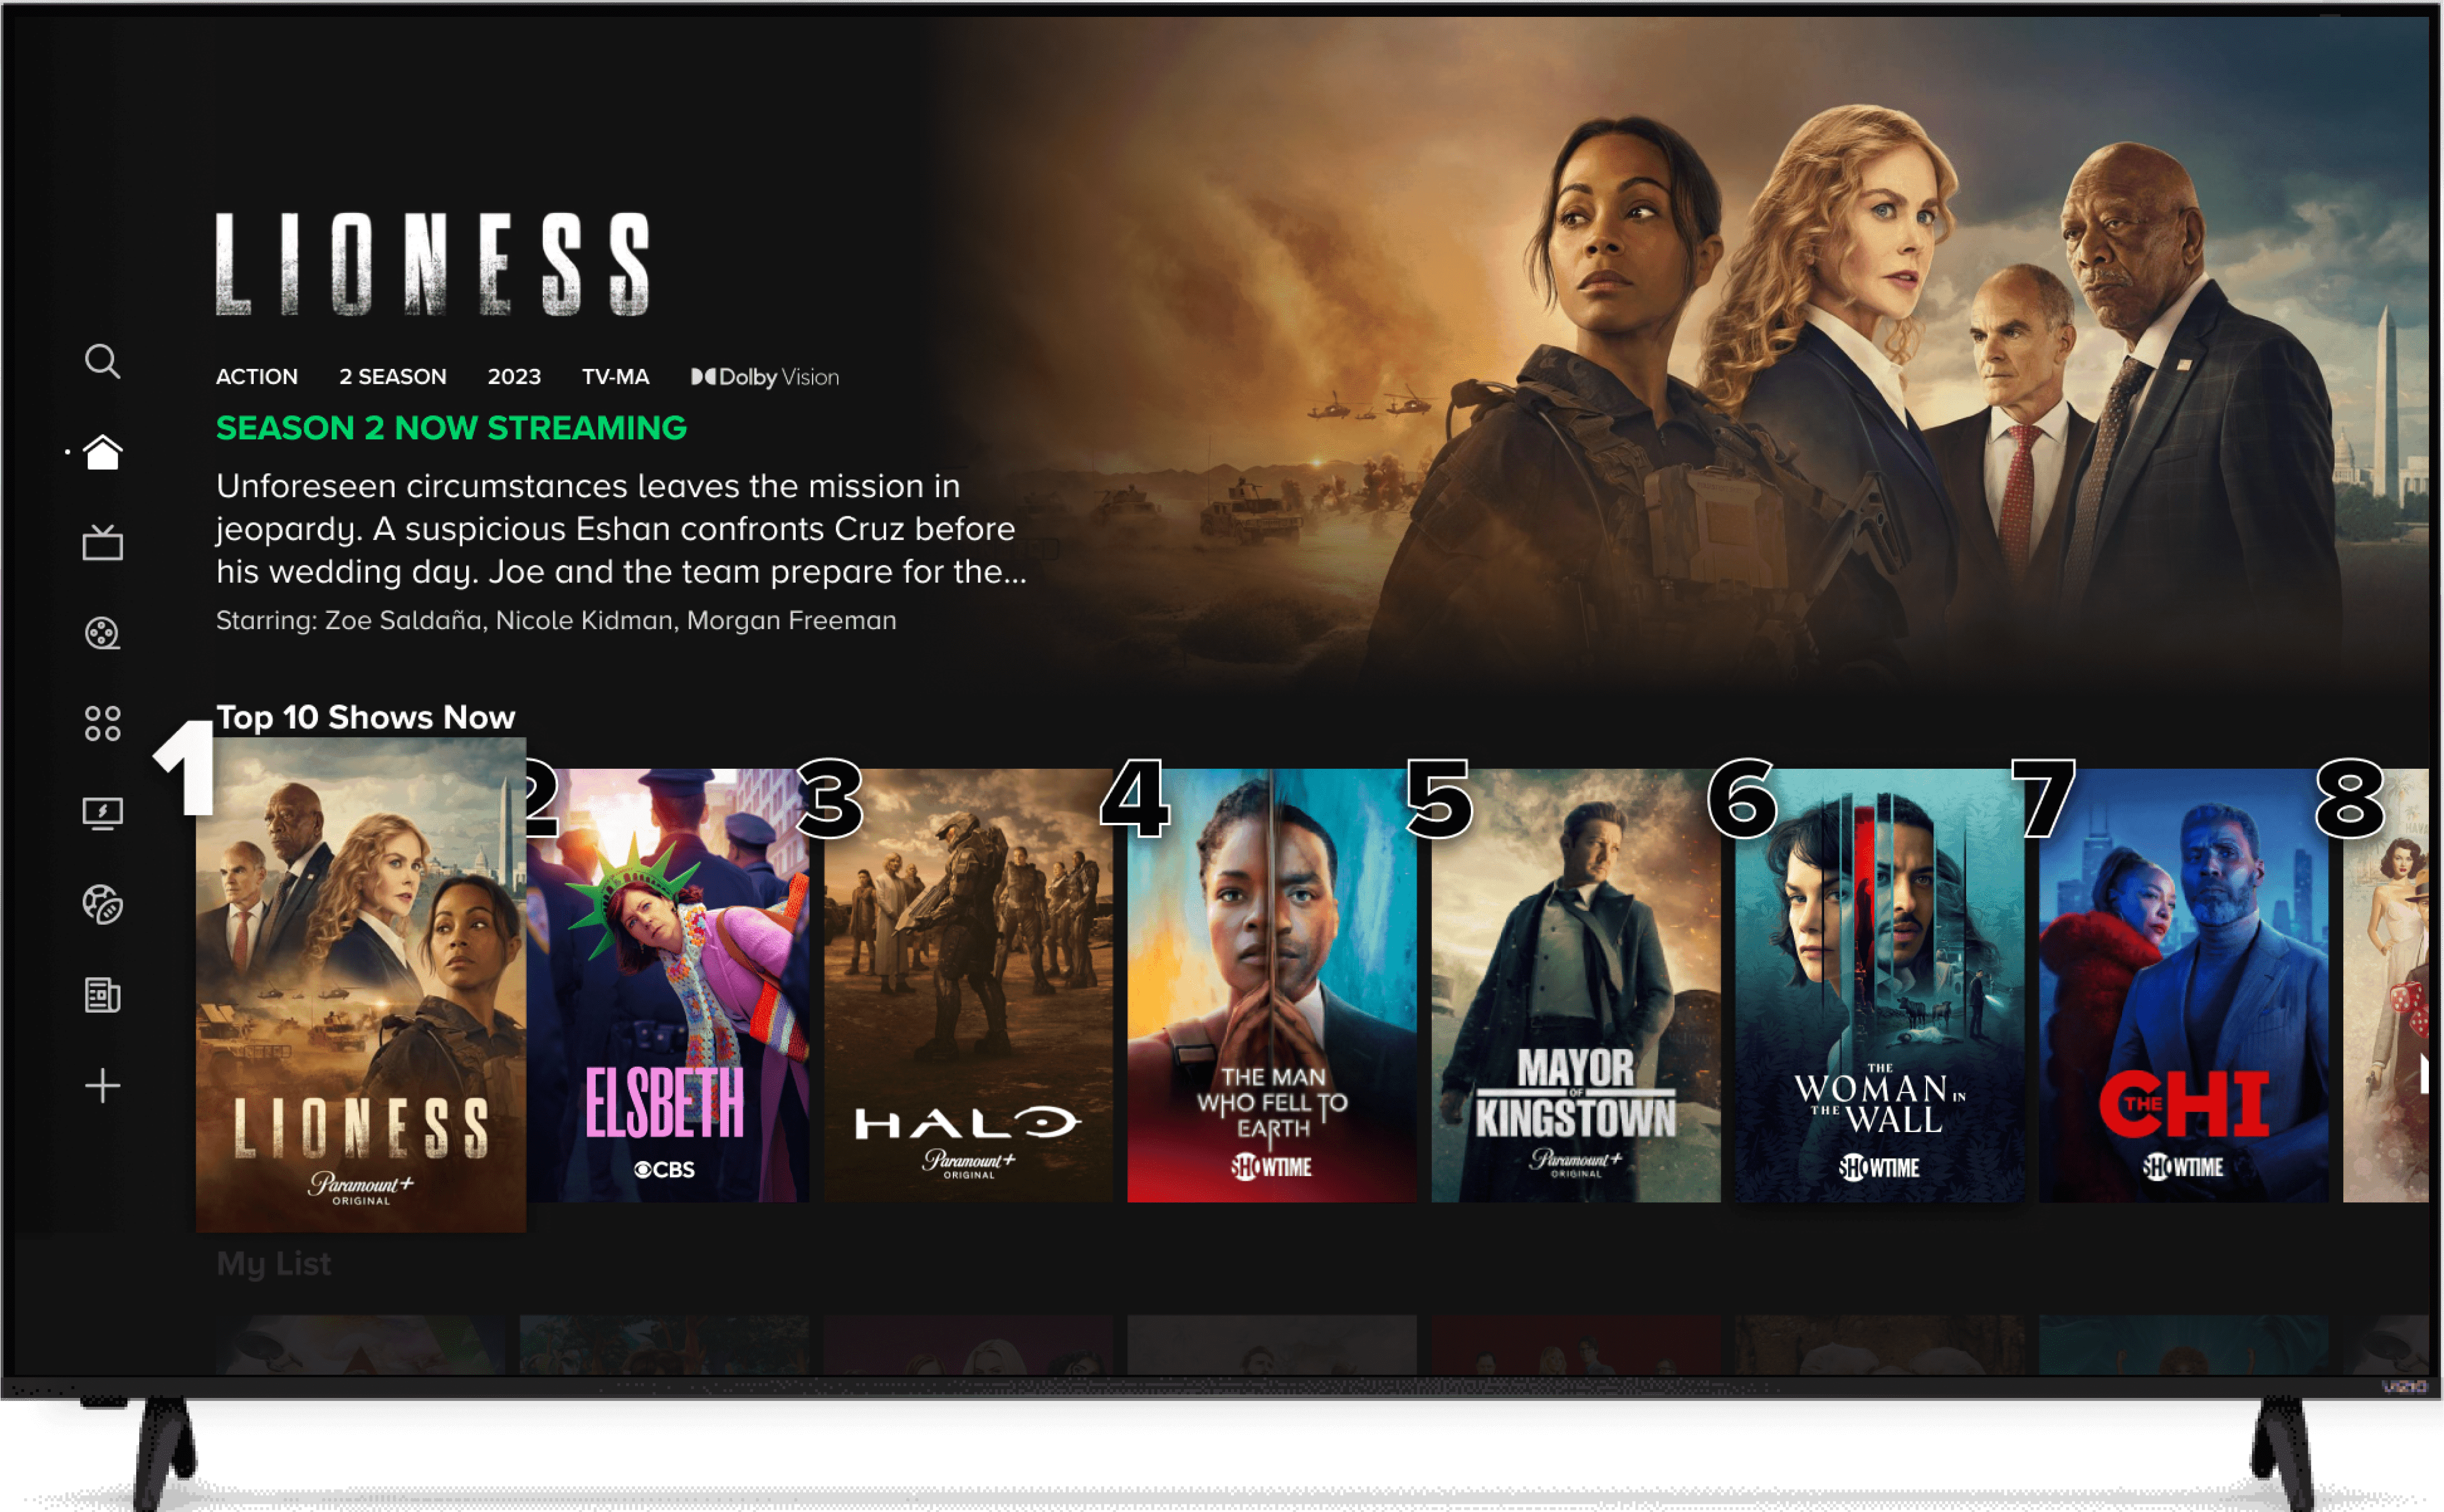
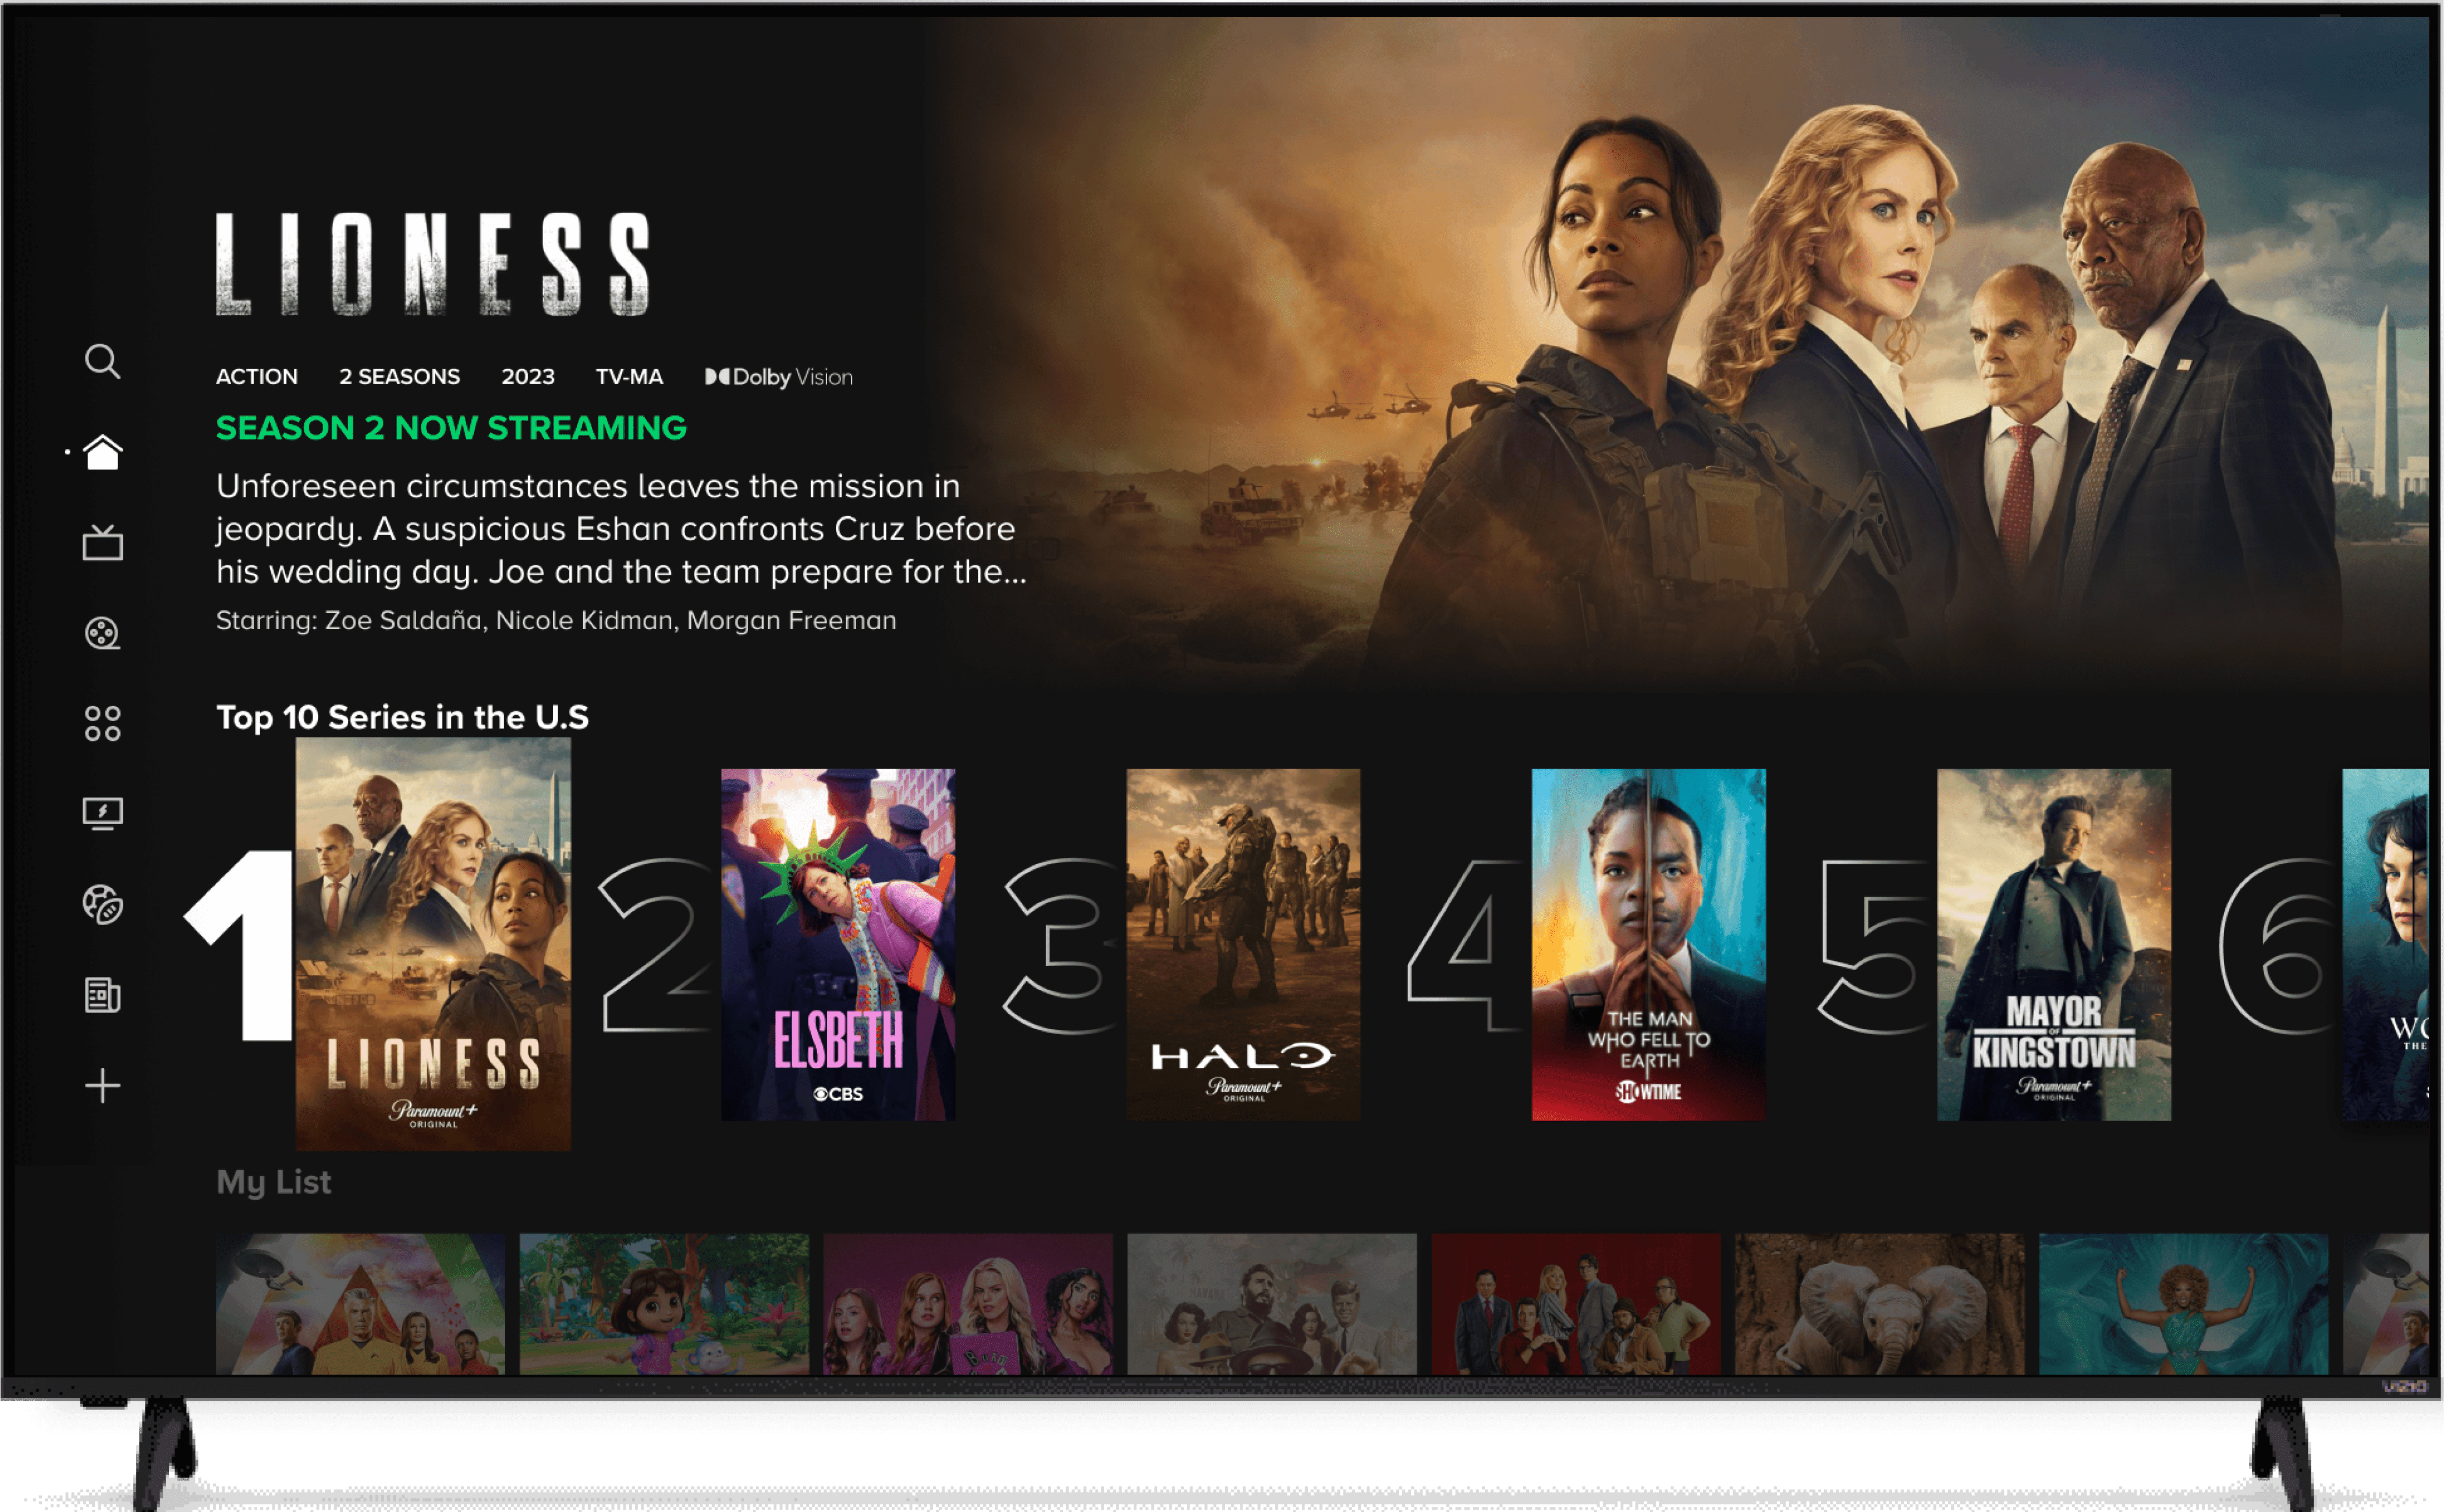
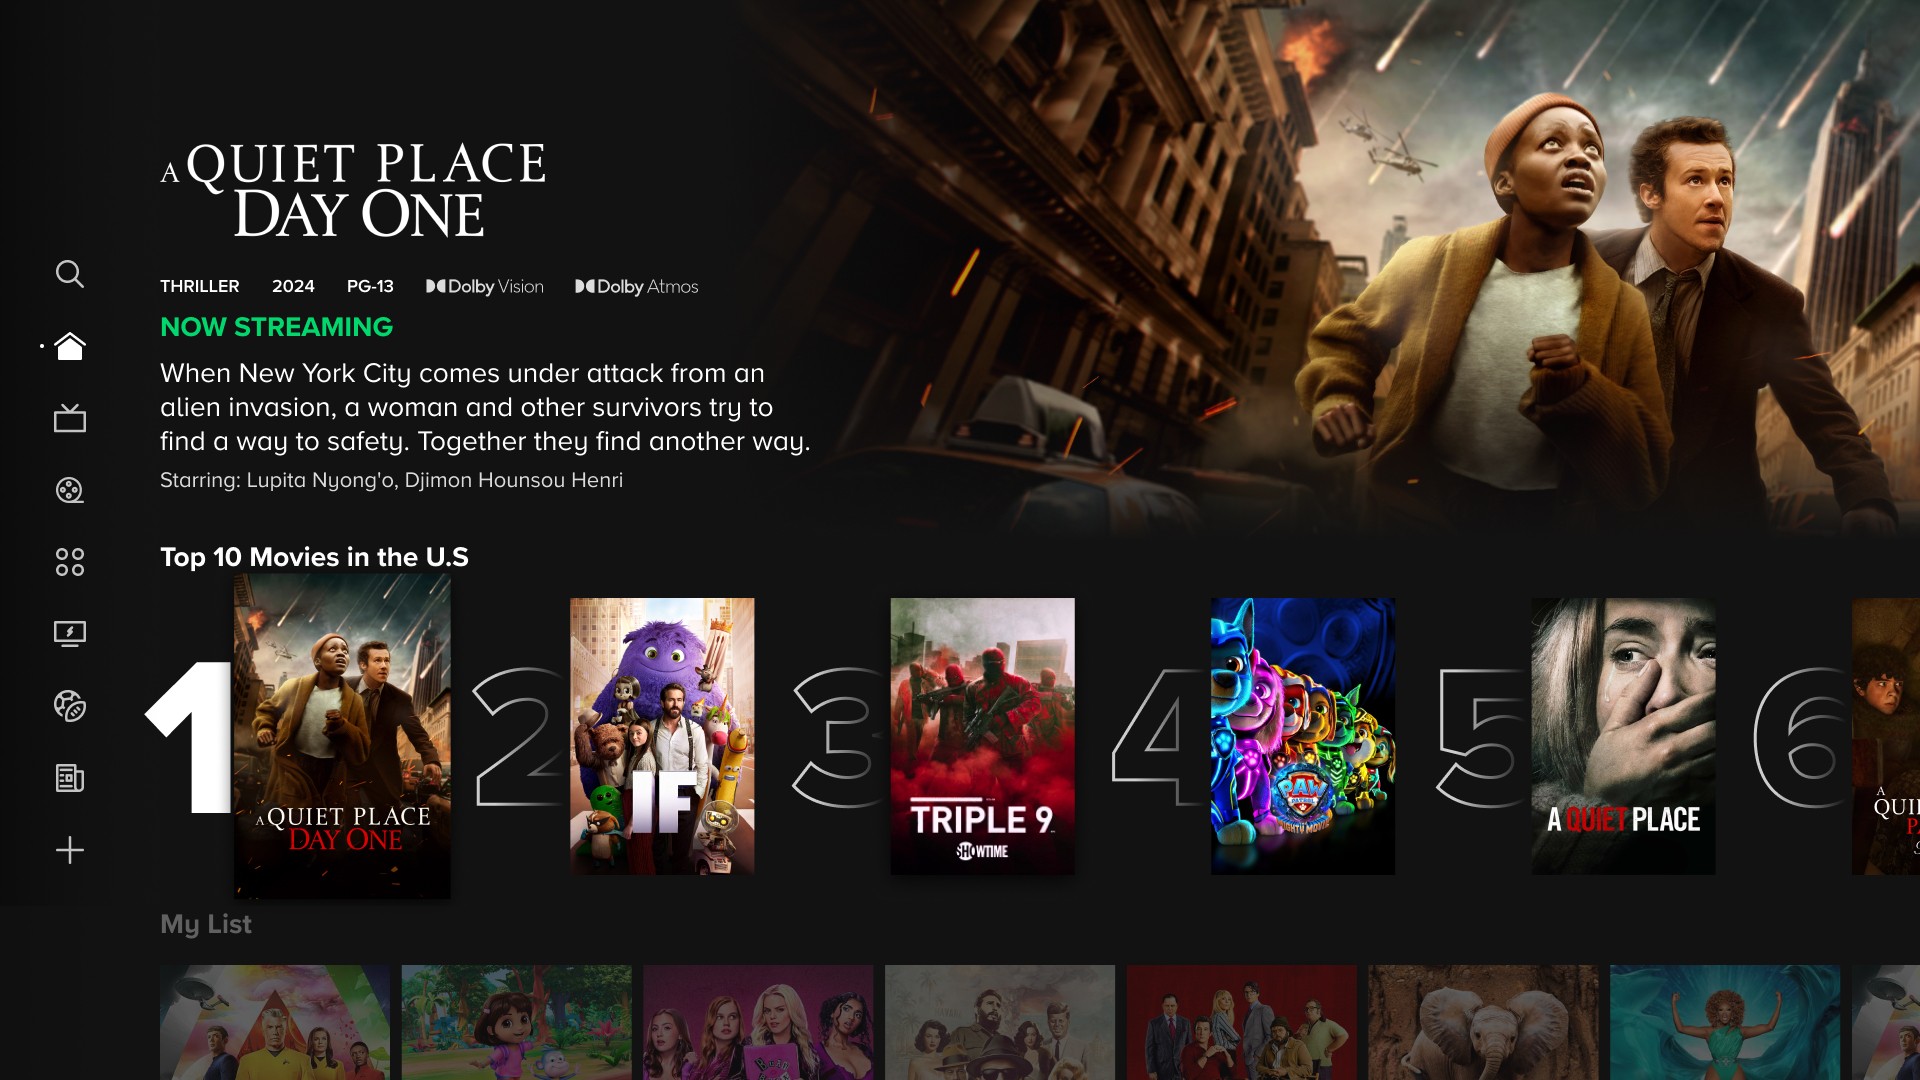
Top 10 Trending
Movies & TV Series
Universal Homepage
OTT
OTT / Phase 1 / Default

OTT / Phase 1 / Scrolled

OTT / Phase 2 / Default
OTT / Phase 2 / Scrolled

Approach for OTT
Results
Metrics
On Roku, this feature not only increased click-through rate and playback rate for the Top 10 carousels but was also contributed to enhancing overall viewership and engagement metrics on the homepage when considering all pertinent validation metrics.
The numeric feature successfully increased playback without negatively affecting general content consumption or engagement on the homepage or across P+, based on relevant validation metrics. Notably, engagement improved for trending carousels with a cap of 10 titles.
Key Metrics
Top 10 Carousel CTR:
+26.29% (+0.64 PPT)Top 10 Carousel Playback Rate:
+25.88% (+0.24 PPT)Avg. Daily Min from Home Carousels (Trending Only):
+19.9% (+0.019 PPT)Avg. Daily Min from Home Carousels (Excluding Trending):
-1.3% (-0.027 PPT)Trending Carousel Video Completions (75% or More):
+20.1% (+0.0002 PPT)
App

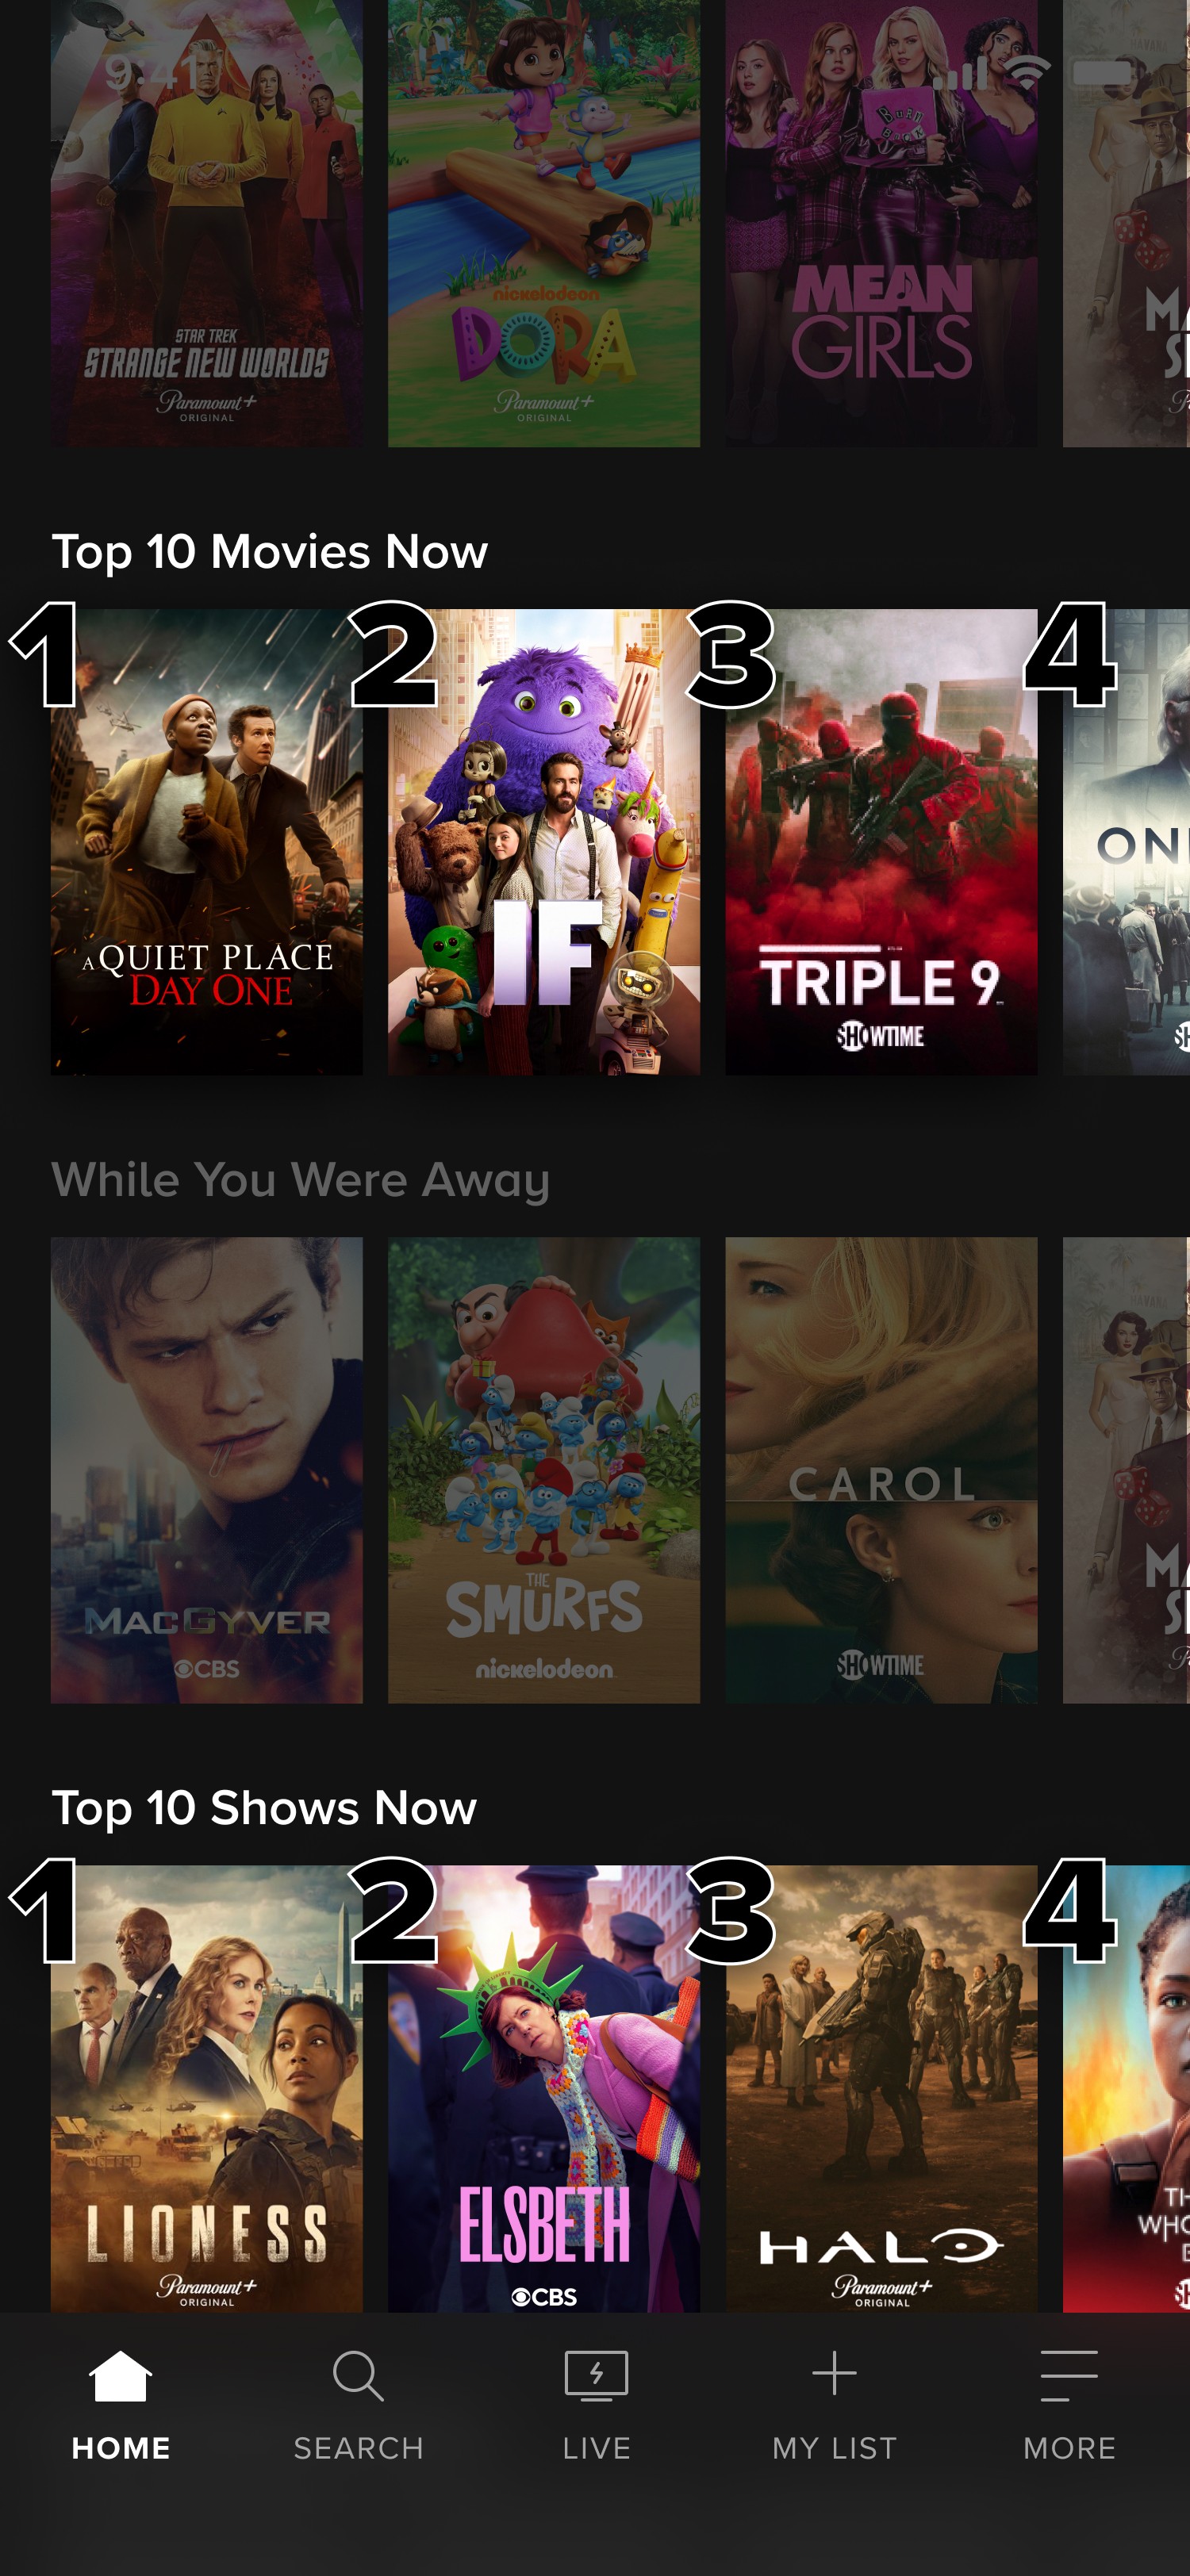


Each week, Paramount+ released our Top 10 trending lists for films and shows. These rankings are based on "views" for each title from the previous week of our most-watched TV shows and films.
Role
Direction
Design Concept
Design Strategy
Product Strategy
Development Strategy
Platforms
tvOS
Fire
Roku
STV
iOS
Android
Web